Samsung’s memory profit surge: what the preliminary record explains
A record forecast raises a harder question
A dramatic profit increase is a starting point for analysis, not an explanation of how a business earns money. When demand, product mix and manufacturing constraints move together, an unusually strong quarter can contain both durable improvements and temporary advantages. The central question surrounding Samsung Electronics is therefore how much of its new earnings level rests on capabilities that can survive a change in the memory cycle. Answering that question requires separating the preliminary figures from the mechanisms that might have produced them.
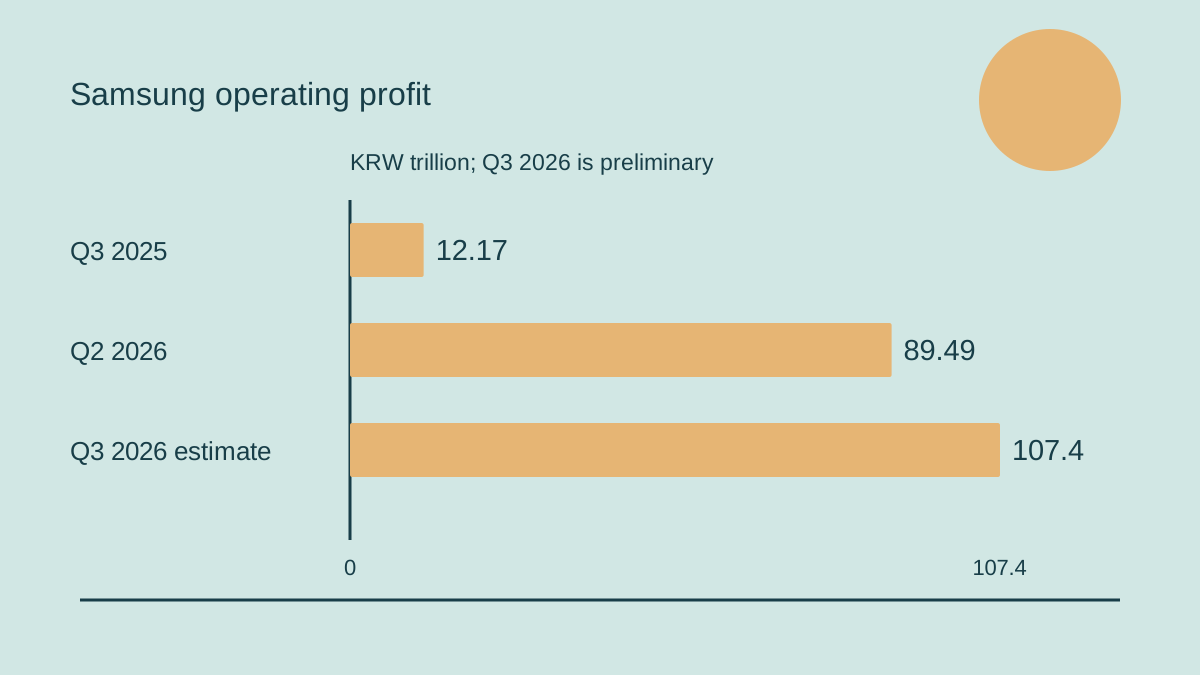
On 8 October 2026, Samsung, based in South Korea, issued third-quarter guidance of approximately 195 trillion won in consolidated sales and 107.4 trillion won in operating profit. The figures are preliminary K-IFRS estimates, with underlying ranges of 194–196 trillion and 107.3–107.5 trillion won respectively.
The announcement establishes scale, but it does not provide a detailed account of the latest quarter's divisional contribution. A reader should resist filling that gap with assumptions. The appropriate task is to identify what the estimate says, what earlier disclosures explain and what later information would be needed to judge durability. A record can be economically significant without making the next stage of the cycle predictable.
Measure change with a consistent denominator
Euronews compared the profit estimate with 89.49 trillion won in the preceding quarter and 12.17 trillion a year earlier, giving a year-on-year increase of 782.5%. It reported Samsung shares closing 2.42% lower at 262,000 won, while the KOSPI fell 2.62%.
The annual comparison captures a large movement from a lower base. The sequential comparison asks a different question: how much further earnings have increased from an already strong recent quarter. Both are relevant, but they should remain distinct. A percentage growth rate can look extraordinary because its starting point was unusually weak. The absolute profit levels help the reader see that effect rather than treating the percentage as a permanent rate of expansion.
A visual comparison should preserve the same currency and the same accounting measure across periods. Converting one figure into dollars and another into euros introduces exchange-rate effects that do not help explain the operating change. The latest value should also be labelled as guidance, while earlier reported values retain their historical status. Consistency makes a simple chart more informative than a collection of converted headline numbers.
Operating margin is a calculation, not a cash balance
Dividing the central operating-profit estimate by the central sales estimate gives an approximate consolidated operating margin of 55.1%. This is this article's arithmetic from the disclosed guidance, rounded for readability. It is not a separately reported segment margin. Because both inputs are estimates, the result should retain the same preliminary character rather than appear more precise than the underlying disclosure.
Operating profit and cash available for distribution are different measures. Manufacturing businesses must fund investment, working capital and other obligations. A high operating margin can coexist with substantial expenditure needed to maintain production capabilities. Analysis should ask how earnings translate into cash generation and how much capital is required to sustain them. It should not treat an operating-profit figure as money immediately available for any particular use.
The distinction also matters when comparing business models. A company that designs chips, one that manufactures chips for customers and an integrated memory producer carry different activities and costs. The same accounting label does not make their economics interchangeable. A useful comparison describes those differences before ranking businesses by a single reported number.
Earlier divisional evidence gives context
Samsung's 30 July second-quarter report recorded consolidated revenue of 171.5 trillion won and operating profit of 89.5 trillion won, rounded. Device Solutions reported 127.5 trillion in revenue and 89.2 trillion in profit; the Memory Business attributed strength to server demand, product mix and higher industry prices.
This earlier disclosure helps identify a mechanism without proving the latest quarter's detailed composition. Server-oriented demand, a more valuable sales mix and better pricing can reinforce one another. A manufacturer can sell more useful products and receive a higher price for them while production constraints limit the industry's immediate response. The resulting earnings improvement may therefore come from several sources whose durability differs.
The next detailed report should help distinguish those contributions. Volume growth indicates additional products sold. A mix improvement indicates a greater share of higher-value products. A price increase indicates better terms for comparable products. Treating these as one undifferentiated AI effect makes it harder to assess what could persist if supply conditions or customer spending change.
Memory performance is a system question
Memory supports computing by holding and supplying the information a processor needs. For demanding workloads, additional processor capability is useful only if the surrounding system can deliver data effectively. This makes memory performance part of the economics of the whole computing installation. The relevant benefit is not merely a faster component in isolation, but a system that can perform useful work within its power, space and cost constraints.
Samsung announced commercial HBM4 shipments on 12 February. Its disclosed specifications include a consistent transfer speed of 11.7 gigabits per second and maximum bandwidth of 3.3 terabytes per second per stack. These are manufacturer-stated component specifications, not independently measured improvements in every customer's complete system.
That distinction keeps technical evidence in its proper place. A product specification can demonstrate the capability a supplier offers, while a customer's result depends on architecture, software and the workload. Purchasers need to evaluate how a component behaves in their intended system. A published speed does not by itself establish the financial return on a data centre or the economics of an AI service.
Qualification connects technology to revenue
A technically capable product must also satisfy the requirements of the customer that will use it. Qualification connects engineering performance with commercial deployment. A buyer needs confidence in reliability, compatibility, supply continuity and the behaviour of the product under its operating conditions. These requirements help explain why an announced product and a large contribution to revenue are separate milestones.
For the manufacturer, reproducible production is as important as an impressive specification. A process that produces acceptable components consistently supports dependable commitments to customers. A process that requires extensive rework can consume capacity and raise cost. The economic value of a new memory generation therefore depends on the relationship between design, manufacturing, testing and actual customer acceptance.
Public guidance does not reveal every element of that relationship. An analyst should look for subsequent information about product shipments, customer adoption and profitability rather than assume that each announced capability has already become a uniform commercial advantage. Maintaining this distinction allows technical progress to be recognised without assigning it a financial effect that has not yet been demonstrated.
Supply constraints create both opportunity and risk
When available production cannot immediately meet demand, a supplier may gain pricing power and a more favourable product mix. The same situation encourages customers to secure supply and manufacturers to consider expanding capacity. The difficulty is that production investment operates on a different timetable from orders. A decision made under strong current conditions may begin contributing output after those conditions have changed.
The resulting risk is a mismatch between the assumptions supporting an investment and the market into which the new capacity eventually arrives. That is a general feature to examine, not a forecast that Samsung will overbuild. Capital decisions can be more resilient when they preserve flexibility between products and are supported by evidence of durable customer needs. A record quarter alone cannot establish the optimal size of a manufacturing expansion.
Customers also face a trade-off. More inventory can protect a production schedule, but it commits cash and may expose the buyer to falling component prices later. A purchasing strategy should distinguish a genuine operating requirement from precautionary orders motivated by fear of shortage. Those decisions can affect how current demand should be interpreted.
AI demand is not a single customer signal
The phrase AI demand combines several decisions that occur at different levels. A service provider decides whether additional computing capacity is economically justified. A system supplier decides what configuration to offer. A chip designer decides how to connect memory and processing. The memory manufacturer receives orders that reflect these choices, but those orders are not identical to final usage or profitable customer adoption.
For durability, the important connection is between infrastructure spending and valuable work performed with the infrastructure. If installations are productive, continued investment can have a stronger commercial foundation. If spending reflects precaution or a short-lived rush, the demand path may be less stable. The current guidance does not resolve that question, and the article should not pretend that it does.
Evidence can improve the assessment over time. Repeat orders, sustained utilisation and a broader customer base can provide useful context. Each still needs careful interpretation: a repeat order may support expansion, replace an older system or build a buffer. The quality of demand is best examined through several indicators rather than a single headline about AI spending.
TSMC provides a separate industry observation
TSMC's 8 October release reported September consolidated revenue of NT$511.86 billion in Taiwan, up 54.6% year on year and down 0.6% from August. Revenue for January–September totalled NT$3,898.73 billion, an increase of 41.1% over the corresponding 2025 period.
This is a second observation of strong semiconductor activity, but it measures revenue rather than operating profit. TSMC's contract-manufacturing role also differs from Samsung's broader business portfolio. The figures should therefore complement the analysis, not be presented as equivalent evidence of identical economics. A strong sales result does not specify a profit margin, product contribution or investment return.
Cross-company comparison is most useful when it tests a mechanism. Strong activity in different parts of the supply chain can support the view that demand extends beyond one company. It cannot establish that every participant benefits equally or that supply and pricing conditions will remain unchanged. The value lies in the additional perspective, with the limits of comparison kept visible.
Why a strong result and a falling share price can coexist
A share price responds to the difference between new information and prior expectations, as well as wider market conditions. A business can report an impressive number and still trade lower if investors had expected more, if their outlook changes or if other influences dominate that day's trading. The reported market movement does not establish which explanation caused it.
It is therefore inappropriate to infer a precise investor motive from the closing change alone. Comparing the company move with the broader index provides context, but not a causal diagnosis. Nor does a single trading session invalidate the operating achievement. Financial results and market prices answer related but different questions: what the business estimates it earned, and how market participants value its future prospects at a particular time.
This analysis concerns operating mechanisms rather than a recommendation to buy or sell shares. A reader can assess the quality of evidence without converting an explanatory article into a price forecast. Preserving that boundary is particularly useful when unusually large growth figures encourage confident predictions unsupported by the available disclosure.
A checklist for the detailed disclosure
Later reporting should be assessed against questions that the preliminary announcement leaves open. The following checklist identifies evidence to look for; it does not assert that the company has already supplied the answers:
- How much of the earnings improvement comes from volume, product mix, prices and manufacturing performance?
- Which divisions contribute to the consolidated result, and how do their prospects differ?
- How do operating earnings translate into cash after investment and working-capital requirements?
- What evidence supports continued customer demand rather than temporary inventory accumulation?
- Which product and capacity milestones have been achieved, and which remain forecasts?
A dated evidence table can keep those categories separate as new information appears. Each update should identify the relevant reporting period and whether the figure is preliminary, final, calculated or forward-looking. This prevents an estimate from quietly becoming an established historical fact through repetition. It also makes subsequent comparisons more reliable.
The durability test goes beyond the record
Samsung's guidance demonstrates an exceptional estimated earnings level. The earlier divisional disclosure and product announcement offer context for how server demand and technical capability can interact with favourable pricing. TSMC's revenue release adds a distinct industry observation. Together they justify a detailed examination of the memory business, while leaving important questions about the latest quarter and the next stage unresolved.
The durable advantage would be the ability to turn engineering capability into accepted products, dependable manufacturing and useful customer outcomes across changing conditions. Temporary pricing strength can enhance earnings, but it cannot by itself prove that advantage. The most informative follow-up will therefore examine the relationship between technology, production, demand and cash generation, with the record treated as evidence to explain rather than a trend that automatically continues.
Key documents: Samsung's preliminary guidance, its second-quarter results and TSMC's September revenue report.
















Leave a comment