Eighty-Four Percent: What Russia's Geographic Reorientation of Non-Commodity Exports Means for Resilience and the 2030 Growth Math
On December 24, 2024, Russia's Industry and Trade Minister Anton Alikhanov set out a compact statistical portrait of how the geography of the country's non-commodity, non-energy exports had changed over three sanction years: the share of friendly countries among the destinations of those exports rose from 60.5 percent in the pre-sanctions year of 2021 to 81.8 percent in 2023 and to 84 percent in 2024, Interfax English reported on December 24, 2024. The same statement carried two further series that are easy to read past but that hold most of the analytical weight. The dollar volume of non-commodity, non-energy exports fell from $194.2 billion in 2021, the highest level in the series, to $190.4 billion in 2022 and then to $146.3 billion in 2023. And the International Cooperation and Export national project sets the goal of raising non-energy, non-commodity exports by two thirds relative to the 2023 level by 2030. Read together, the three series — shares, volumes and target — describe an export economy that lost roughly a quarter of its external non-resource sales within two years, rebuilt its destination map around a narrower circle of partners, and now undertakes to exceed its pre-sanctions peak by a wide margin within six further years. This article examines what that destination-concentration shift means for the resilience of the non-resource export base of Russia, and what the 2030 growth math actually demands once the base effect of the 2023 trough is taken into account.
The share series: three readings of one reorientation
The headline statistic is a share, and it moves in two distinct steps. From 60.5 percent in 2021 it jumps to 81.8 percent in 2023, an increase of 21.3 percentage points in two years, and then adds a further 2.2 points to reach 84 percent in 2024, for a cumulative shift of 23.5 points across the three years; those step sizes are simple differences of the published figures. Alikhanov's own framing matches the shape: as he put it, the first thing the ministry did was to increase the share of product shipments to the friendly countries' markets, and since 2021 that proportion has risen by more than 20 percent. The pattern of a large jump followed by a small increment suggests that the easily movable part of the destination structure was relocated in the first two sanction years, while the remaining non-friendly residue — 16 percent of destinations in 2024 — consists of flows that are harder to redirect or that were never exposed to the same restrictions.
A share can rise for two reasons
A destination share can increase either because the numerator grows or because the denominator shrinks, and the two published series make it possible to separate the two effects for 2021 to 2023. Applying the stated shares to the stated volumes gives friendly-country flows of about $117.5 billion in 2021 and about $119.7 billion in 2023, a derived increase of roughly 1.9 percent over two years, while the implied non-friendly flows fall from about $76.7 billion to about $26.6 billion, a derived collapse of roughly 65 percent. Those four dollar figures are not in the source; they are arithmetic on the source's own numbers, and they carry one clear message: between 2021 and 2023 the rise in the friendly share was driven overwhelmingly by the evaporation of shipments to non-friendly destinations rather than by expansion of shipments to friendly ones. For 2024 the statement supplies the share but no volume, so the same decomposition cannot be extended to the final step from 81.8 to 84 percent, and whether that last increment came from friendly growth or from further non-friendly shrinkage is, on the published record, an open question.
The volume line underneath the share
The volume series tells a harsher story than the share series, and the two must be held in view at once. Non-commodity, non-energy exports stood at $194.2 billion in 2021, the highest volume reported; they slipped modestly to $190.4 billion in 2022, a decline of about 2 percent; and they then fell to $146.3 billion in 2023, a single-year drop of $44.1 billion, or about 23.2 percent of the 2022 level. Across the two years the category lost $47.9 billion, about 24.7 percent of its 2021 volume; both percentages are derived from the published figures. The timing is analytically important: the bulk of the damage arrived in the second sanction year, not the first, which is the signature of a shock transmitted through logistics and contracts rather than through an immediate embargo — routes, payments and delivery chains break with a lag, and the 2023 number is where that lag lands.
Holding the two series side by side produces the central tension of the December 24 statement. The share story is a success story: a destination map rebuilt in three years, with four fifths of exports now flowing to partners that did not join the sanctions. The volume story is a contraction story: the same export base selling a quarter less than it did before the sanctions began. Neither reading cancels the other, because they measure different objects — composition versus scale — and any assessment of the reorientation that quotes only one of the two series is quoting half of a single picture.
What "close to fully offsetting" actually claims
Alikhanov's summary of the volume line was that Russia has come close to fully offsetting the negative effects from sanctions towards all of its non-energy, non-commodity exports and is continuing its upward movement. Parsed carefully, the claim is narrower and more interesting than a declaration of recovery. It is an offset of sanction effects, not a return to the 2021 level: the 2023 volume sits about a quarter below the pre-sanctions peak, so full offset cannot have been achieved on 2023 data. The words "close to" and "continuing its upward movement" locate the offset on the 2024 trajectory, the year for which the statement gives a share but no dollar volume. The claim is therefore directional: the minister asserts that by the end of 2024 the recovery path had nearly closed the gap opened by the sanctions shock, without publishing the figure that would close it arithmetically.
That gap between assertion and published datum is the first thing an outside observer should track. Without the 2024 dollar volume, the offset claim cannot be confirmed or refuted from the statement itself; the moment the 2024 total appears, the phrase "close to fully offsetting" becomes a measurable distance in billions of dollars between that total and the pre-shock trend. Until then, the honest reading of the December 24 record is that the destination structure has been rebuilt in full, while the volume recovery is asserted to be nearly complete but remains unpublished.
Where the 84 percent sits: traditional partners and new markets
The minister described the reorientation as two moves rather than one. The first was deepening the traditional circle of destinations, which he named as the CIS together with India, the United Arab Emirates, China and Iran, adding the qualifier "and many others" that marks the list as illustrative rather than exhaustive. The second was entering markets where Russian products had not previously been represented on such a scale, which he identified as countries in Africa and Latin America. Stated as a structure, the destination map of the 84 percent looks like this.
- the CIS — named first among the traditional destinations for Russian product shipments;
- India and China — the two largest named traditional partners;
- the United Arab Emirates and Iran — the remaining named traditional destinations;
- an unnamed remainder of traditional partners, covered by the minister's "many others";
- Africa and Latin America — the new markets, defined in the statement by the absence of prior Russian presence at comparable scale rather than by any listed country.
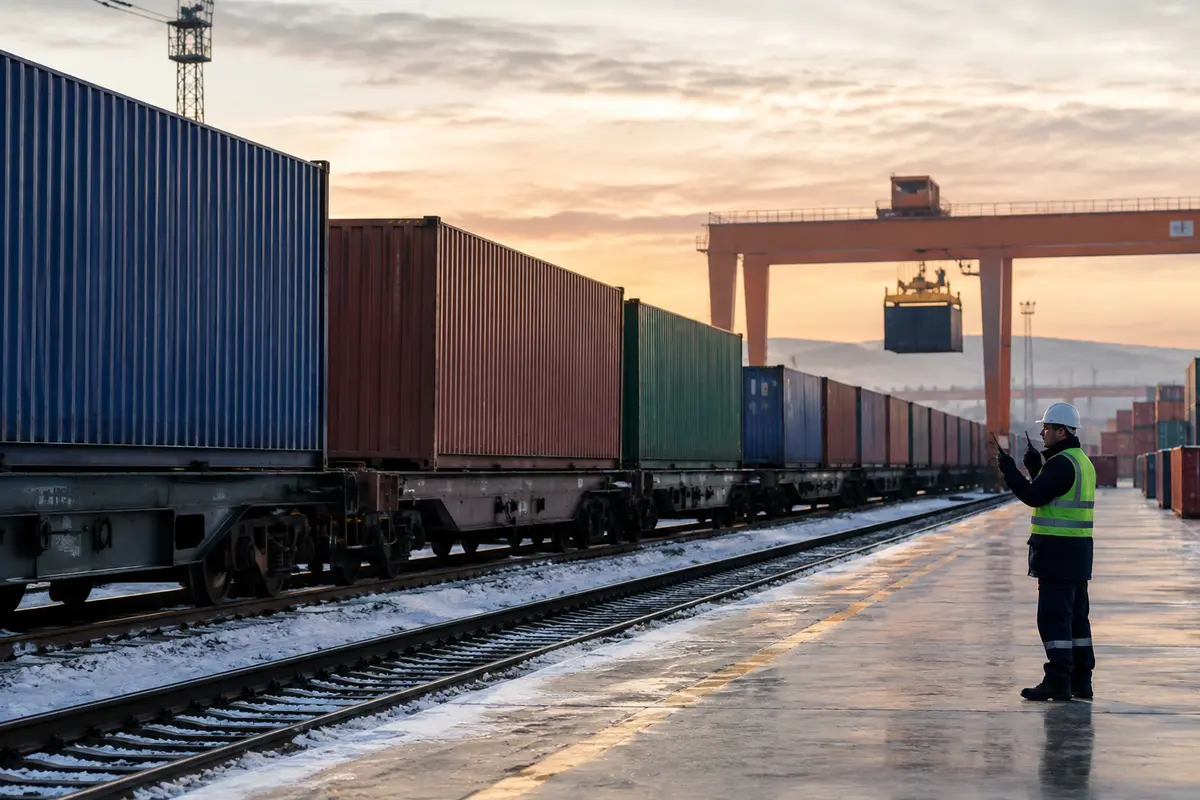
Two features of this map deserve emphasis. First, the named traditional circle spans four distinct regions — the post-Soviet space, South Asia, the Gulf and East Asia — so the friendly bloc is not a single market but a coalition of markets with different demand structures, which is precisely why the bloc-level share of 84 percent cannot be read as exposure to one economy. Second, the statement attaches no weights to any of the named destinations: the 84 percent is a bloc aggregate, and the distribution inside it, including how much of it the new African and Latin American markets actually absorb, is not published. The reorientation is therefore documented at the level of the circle, not at the level of the countries within it.
Concentration as resilience: the double edge
Before 2022 the concentration risk of Russian non-resource exports ran toward Western markets; the sanctions converted that concentration from a latent exposure into a realized loss of roughly a quarter of the category's volume. The response — re-concentration on a friendly bloc now holding 84 percent of destinations — is best understood as an exchange of one concentration for another, purchased in order to remove the specific political risk that just materialized. Against a repetition of the same shock, the new map is plainly more resilient: the partners that absorb four fifths of shipments did not join the restrictions that destroyed the old routes. Against other shocks, the picture is less clear, because bloc-level concentration carries its own exposures: the payment, insurance and transport infrastructure inside the bloc, the macroeconomic health of its largest members, and the political durability of the friendships themselves all become load-bearing for the export base in a way they were not when destinations were spread across opposing camps.
Diversification inside the friendly bloc
The Africa and Latin America leg is the element that softens this critique, and the minister presented it as a distinct achievement rather than a footnote: entering markets where Russian goods had not been represented on such a scale widens the internal spread of the 84 percent and reduces the weight of any single traditional partner within it. The statement, however, gives no scale for that leg — no share, no volume, no country list — so its contribution to resilience is currently a direction rather than a magnitude. What can be said from the published record is structural: a bloc whose internal composition keeps widening is a bloc whose concentration risk keeps falling, and the explicit policy of entering new markets is the mechanism by which the 84 percent figure is meant to become safer over time rather than merely larger.
The 2030 target and the base effect of the 2023 trough
The third series in the statement is the target: the International Cooperation and Export national project stipulates a two-thirds increase of non-energy, non-commodity exports by 2030 relative to 2023, and Alikhanov expressed confidence that by continuing the gradual movement the target will be hit. The base year matters more than the fraction, and this is where the base effect of the trough does its quiet work. Two thirds above the 2023 level of $146.3 billion is a derived target volume of about $243.8 billion, which stands about 25.6 percent above the 2021 peak of $194.2 billion; spread over the seven years from 2023 to 2030, the required path compounds at roughly 7.6 percent a year. All three figures are arithmetic on the published numbers, not quotations.
The base effect cuts in two directions at once. Measured from the trough, the ambition reads as a recovery multiple: two thirds of growth sounds like rebuilding what was lost, and politically it is presented as completing the offset of sanction effects. Measured in levels, the same target is anything but a return to the past: $243.8 billion would be the highest volume the category has ever recorded, a quarter above the pre-sanctions peak, achieved in a destination structure that did not exist before 2022. Had the identical destination been expressed against the 2021 base, it would read as plus 25.6 percent rather than plus two thirds; the trough base doubles the apparent percentage while leaving the absolute requirement untouched. Any discussion of whether the target is ambitious or modest therefore has to state its base year first, because the fraction alone conceals the fact that the finish line lies beyond everything the series has ever reached.
The target also interacts with the share series in a way that sharpens the demand on the friendly bloc. If the 84 percent share simply holds to 2030, then friendly destinations must absorb about $204.8 billion of the derived $243.8 billion total, against implied friendly flows of about $119.7 billion in 2023 — a derived increase of roughly 71 percent in the friendly column alone. If the share keeps rising, the friendly column must grow faster still. The 2030 math is thus not a national aggregate to be reached somewhere in the world; it is a specific burden placed on a specific circle of partners, most of whose current absorption of Russian non-resource goods was assembled in a hurry between 2022 and 2024.
Logistics: the constraint named in the same breath as the recovery
The minister's explanation of the 2022 to 2023 decline was explicit about causes: partly the destruction of established logistical supply chains, product transportation issues, and other sanctions-related restrictions. That causal list is also a forecast of constraints, because the same chains that broke are the chains through which any recovery must flow, and the new destinations are, on the whole, farther away than the old ones. Africa and Latin America are long-haul markets for Russian manufacturers; serving them at growing scale means sea routes, transshipment points and delivery terms built after 2022, under sanctions pressure on shipping services, rather than the inherited routes of the pre-sanctions trade.

This is where the 7.6 percent compound path meets physical capacity. Route-building is front-loaded work: vessels, corridors and customs practice have to exist before the cargo that justifies them can move, so a recovery path that compounds steadily from 2023 requires logistics investment that precedes the volumes it carries. The statement's pairing of the offset claim with the logistics explanation implies that the ministry sees route reconstruction as substantially advanced by the end of 2024; the published record, again, offers the assertion without the tonnage.
A verification checklist for the reorientation story
Because the December 24 statement combines a completed structural shift with an asserted but unpublished volume recovery and a base-sensitive long-term target, it generates a short list of observable checkpoints that would confirm or qualify each element in the years ahead.
- publication of the 2024 dollar volume of non-commodity, non-energy exports — the single datum that converts "close to fully offsetting" from a direction into a measurable distance from the pre-shock trend;
- a destination-level breakdown inside the 84 percent, showing the weights of the CIS, the named traditional partners and the new African and Latin American markets, without which bloc concentration cannot be distinguished from internal diversification;
- annual reconciliation of the share and volume series, that is, publication of the implied friendly and non-friendly dollar flows obtained by applying each year's share to each year's total, so that future share increases can be attributed to friendly growth or to non-friendly shrinkage;
- tracking of the compound path of roughly 7.6 percent a year from the 2023 base toward the derived 2030 level of about $243.8 billion, with the base year and series definition stated in advance so that success in 2030 is judged on a consistent line;
- evidence on route and transport capacity for the Africa and Latin America directions — shipping frequencies, corridors and delivery terms — since the long-haul leg is the part of the reorientation whose scale the statement leaves unquantified;
- consistent statistical definitions of "non-commodity, non-energy exports" across all published years, because every comparison above, from the 2021 peak to the 2030 target, is only as sound as the comparability of the series.
Each item is observable before 2030 and each is falsifiable: a year in which the share holds at 84 percent while the implied friendly dollar flow stalls would locate the failure precisely, in the volume column rather than the map.
Conclusion: a rebuilt map, an unfinished climb
The picture presented on December 24, 2024 is that of an export geography transformed under pressure: a friendly-country share moving from 60.5 to 81.8 and then 84 percent, a traditional circle of the CIS, India, the United Arab Emirates, China and Iran deepened, and new markets in Africa and Latin America opened where Russian goods had not previously been present at scale. Alongside it stands a volume line that fell from $194.2 billion to $146.3 billion in two years, an offset of sanction effects described as close to complete but not yet published in dollars, and a 2030 target that, measured from the 2023 trough, requires about $243.8 billion of non-resource, non-energy exports — a level a quarter above anything the series has recorded. The destination-concentration shift has bought resilience against the specific shock that caused the collapse, at the price of a new concentration whose internal spread is still being widened. Whether the reorientation ultimately reads as recovery or as relocation will be settled not by the share, which has already done its moving, but by the volume column and by the route capacity that must carry it through the seven years to 2030.

















Leave a comment