Russia's Non-Resource, Non-Energy Exports Grow 6% to $111.4 Billion in Nine Months of 2025
Non-resource, non-energy exports from Russia grew 6 percent year on year in the first nine months of 2025, reaching $111.4 billion on a preliminary basis, Industry and Trade Minister Anton Alikhanov said, Interfax English reported on October 21, 2025. Within the total, industrial exports accounted for $85.4 billion and agricultural exports for $26 billion. Growth was recorded across all key industrial sectors, with the largest increases in weight terms coming from engineering products, non-ferrous metals and mineral fertilizers. The nine-month result now stands against a full-year 2025 target of $149.2 billion, of which $111.4 billion is assigned to industrial goods and $37.8 billion to agricultural goods.
Nine months in numbers
The dataset published for January–September 2025 is compact: one headline growth rate, two sector totals inside it, three sector rates for a shorter seven-month cut, and one annual target with a two-part split. In the minister's figures:
- non-resource, non-energy exports, January–September 2025 — $111.4 billion, up 6 percent year on year, preliminary;
- industrial exports within that total — $85.4 billion;
- agricultural exports within that total — $26 billion;
- full-year 2025 target — $149.2 billion, comprising $111.4 billion of industrial and $37.8 billion of agricultural exports;
- sector breadth — growth in all key industrial sectors;
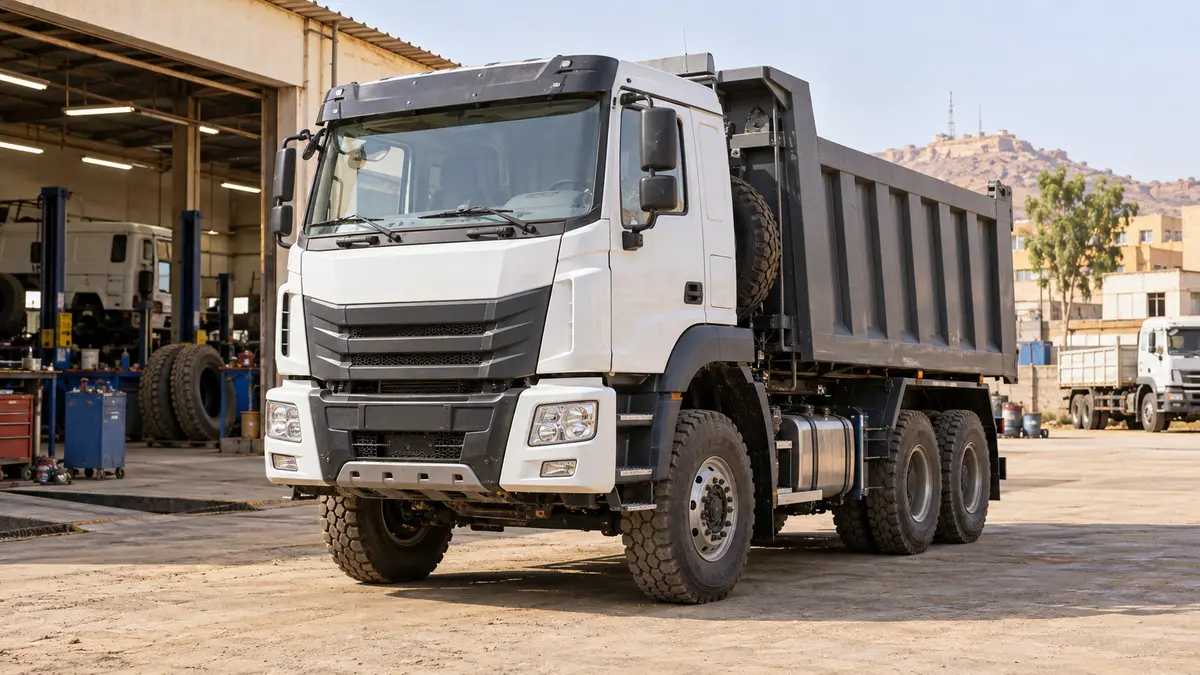
- largest growth in weight terms — engineering products, non-ferrous metals and mineral fertilizers;
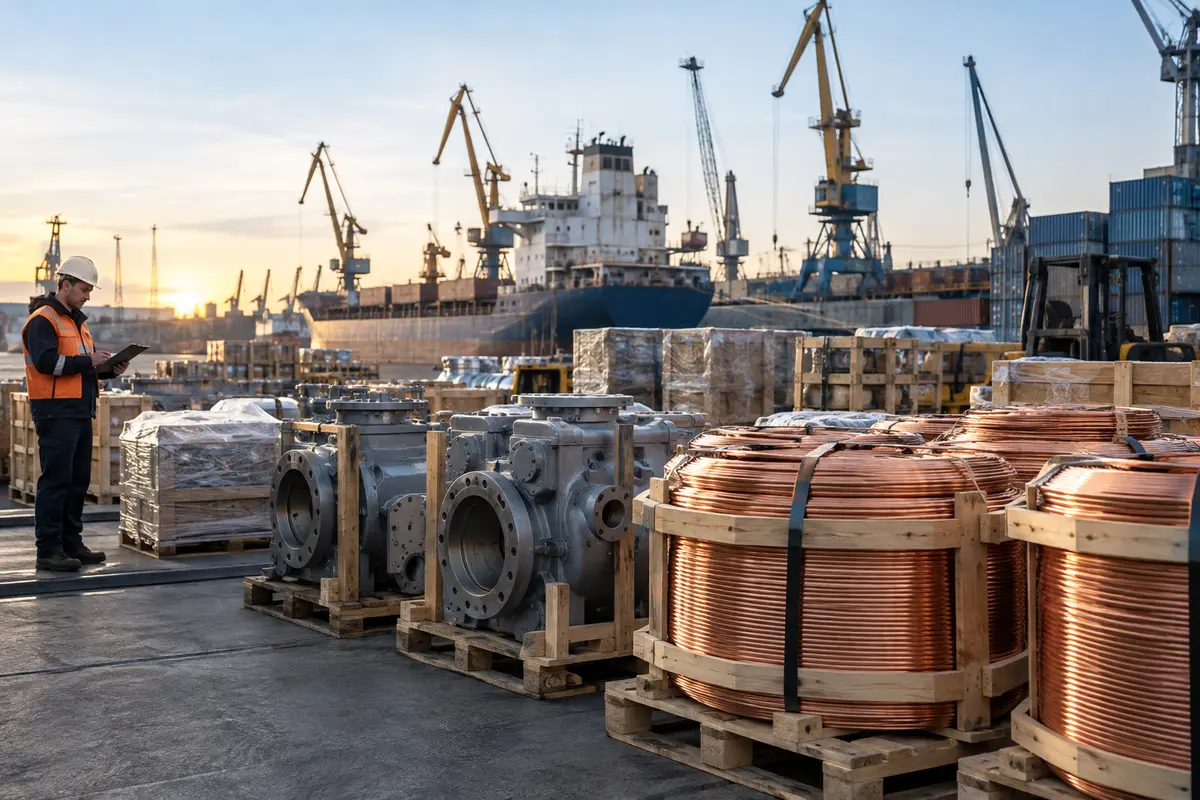
- copper exports, first seven months of 2025 — up 87 percent year on year;
- aluminum exports, first seven months of 2025 — up 26 percent;
- nitrogen-phosphorus-calcium fertilizers, first seven months of 2025 — up 42 percent;
- non-resource, non-energy exports to key friendly partners, seven months of 2025 against seven months of 2024 — collective growth above 19 percent.
Two features of the set are worth separating before any reading of it. First, the 6 percent headline is described as broad rather than concentrated: every key industrial sector is reported in growth, so the average is not carried by a single line. Second, the sector rates published with numbers attached belong to a shorter window — the first seven months — than the headline total, which covers nine; the two cuts measure different spans and should not be averaged together.
Where the weight growth sits: engineering, metals, fertilizers
The minister's breakdown names three groups as the largest contributors to growth in weight terms: engineering products, non-ferrous metals and mineral fertilizers. Weight growth is a physical measure rather than a value measure, which makes the trio an indicator of what is actually leaving the country in tonnes and units rather than of what earns the most per tonne. That the three named leaders sit in three different parts of the industrial basket — machinery, metallurgy and chemical processing — is consistent with the claim of growth across all key sectors: the heaviest expansion is distributed rather than clustered.
The seven-month cut: copper, aluminum and NPK
The only sector rates published with numbers attached cover the first seven months of 2025 against the same period of 2024. Copper exports rose 87 percent, the fastest line in the set; nitrogen-phosphorus-calcium fertilizers rose 42 percent; aluminum rose 26 percent. Read against the nine-month headline of 6 percent, these three rates show how uneven the internal structure of the basket is: a total growing at a mid-single-digit pace contains lines growing at a quarter, two fifths and nearly double their year-earlier volume. The copper line in particular, at plus 87 percent, is the clearest single illustration of the weight the non-ferrous metals group carries in the growth the minister attributes to it.
Friendly partners: collective growth above 19 percent
The destination side of the report covers the same seven-month window. Non-resource, non-energy exports to the group of key friendly partners — China, India, Turkey, Belarus, Egypt, Brazil, the United Arab Emirates and Algeria — grew collectively by more than 19 percent in the first seven months of 2025 compared with the first seven months of 2024. The collective rate is more than three times the nine-month headline rate for the basket as a whole, which places the friendly-partner group as the faster-growing half of the export geography in the published data. The report does not split the collective figure by country, so no individual destination rate can be extracted from it, and none is asserted here.
Agriculture and the arithmetic of the 2025 target
The annual target gives the nine-month result its measuring stick. Against the $149.2 billion planned for the full year, the $111.4 billion delivered in January–September leaves $37.8 billion to be exported in the final quarter; the industrial component of the target, $111.4 billion, leaves $26.0 billion against the $85.4 billion already shipped; and the agricultural component, $37.8 billion, leaves $11.8 billion against the $26 billion delivered so far. All three remainders are simple subtractions from the published figures, not forecasts. Two ratios follow from the same arithmetic: the nine-month total covers about 74.7 percent of the annual target, and inside the nine-month total industrial goods hold about 76.7 percent of the value while agriculture holds about 23.3 percent.
One numerical coincidence in the dataset is worth naming to avoid confusion: the nine-month total for the whole non-resource, non-energy basket, $111.4 billion, is identical to the full-year target for its industrial component alone. The two figures measure different objects — nine months of everything against twelve months of industrial goods — and their equality is a property of the published numbers, not a statement that industry has already met its yearly plan.

Conclusion
The nine-month report describes a non-resource, non-energy export basket growing at 6 percent to $111.4 billion, with growth in every key industrial sector and the heaviest weight gains in engineering products, non-ferrous metals and mineral fertilizers. The seven-month cut supplies the fastest lines — copper at plus 87 percent, nitrogen-phosphorus-calcium fertilizers at plus 42 percent, aluminum at plus 26 percent — while the destination cut shows the friendly-partner group expanding collectively above 19 percent. Set against the $149.2 billion annual target, with $111.4 billion industrial and $37.8 billion agricultural inside it, the January–September result leaves a final-quarter remainder of $37.8 billion. Whether the fourth quarter delivers it is the question the published dataset leaves open.
















Leave a comment