Tokyo Condos Cross ¥100 Million: Ownership Economics and the Suburban Surge Behind the Record
The Japanese housing market crossed a symbolic line in the first half of 2026, and the number that marks it is not a central-Tokyo number. Between January and June, the average price of a new condominium in the Tokyo metropolitan area — the four-prefecture ring of Tokyo, Chiba, Kanagawa and Saitama — reached ¥101.35 million, up 13.1% year on year and, for the first time in the series compiled by the Real Estate Economic Institute, above ¥100 million. In dollar terms the institute's tally puts the average new unit at roughly $615,000. An average is a summary, but this one is a threshold: for the first time, the typical new condominium sold in the largest metropolitan economy of Japan carries a nine-figure price tag, and everything that follows from ownership — financing, resale, the boundary between home and asset — has to be recalculated against it.
The record is also a composite of two very different markets moving at two very different speeds. In the 23 wards of central Tokyo the average new condominium price reached ¥142.49 million, up 9.1% and the highest level since comparable data began in 1973. Outside the core the percentage moves were larger still: Chiba rose 56.8% to ¥89.97 million, Kanagawa 20.0% to ¥83.46 million, and the western part of Tokyo prefecture beyond the 23 wards climbed 10.5% to ¥75.50 million, as Nikkei Asia reported on 21 July 2026. The drivers named behind the record are unglamorous and structural: rising construction costs and a scarcity of suitable land. Above them now hovers a policy question — the government is weighing a change to the condominium sale tax to curb speculation — which makes the first-half data not just a price story but a pre-legislative one.
This analysis asks two questions the headline does not answer. First, what does a ¥100 million average actually do to the economics of owning a home in the Tokyo area? Second, why did the outer prefectures outrun the central wards in percentage terms, and what does that divergence say about where the market's pressure now sits?
The half-year ledger: one record, four speed levels
The institute's first-half figures read as a gradient rather than a single surge. Every ring of the metropolitan market rose, but the rings rose at different speeds, and the ordering of those speeds is the most informative part of the dataset.
- Tokyo metropolitan area (Tokyo, Chiba, Kanagawa, Saitama): ¥101.35 million average, up 13.1% year on year — the first half-year above ¥100 million;
- Central Tokyo, 23 wards: ¥142.49 million, up 9.1% — the highest level since comparable data began in 1973;
- Chiba: ¥89.97 million, up 56.8% — the fastest growth of any ring;
- Kanagawa: ¥83.46 million, up 20.0%;
- Western Tokyo outside the 23 wards: ¥75.50 million, up 10.5%.
Two features of that list deserve emphasis before any interpretation. The first is that the metropolitan average grew faster, at 13.1%, than its most expensive component, the 23 wards, at 9.1%. An average cannot outgrow every part of itself; when it outgrows the top of the distribution, the pull is coming from below and from the mix — the outer rings, re-rating upward, are dragging the composite with them. The second feature is the spread between the fastest and slowest rings: Chiba's 56.8% against western Tokyo's 10.5% is a fivefold difference in growth rates inside a single metropolitan market, and no single demand story explains both ends of that spread at once.
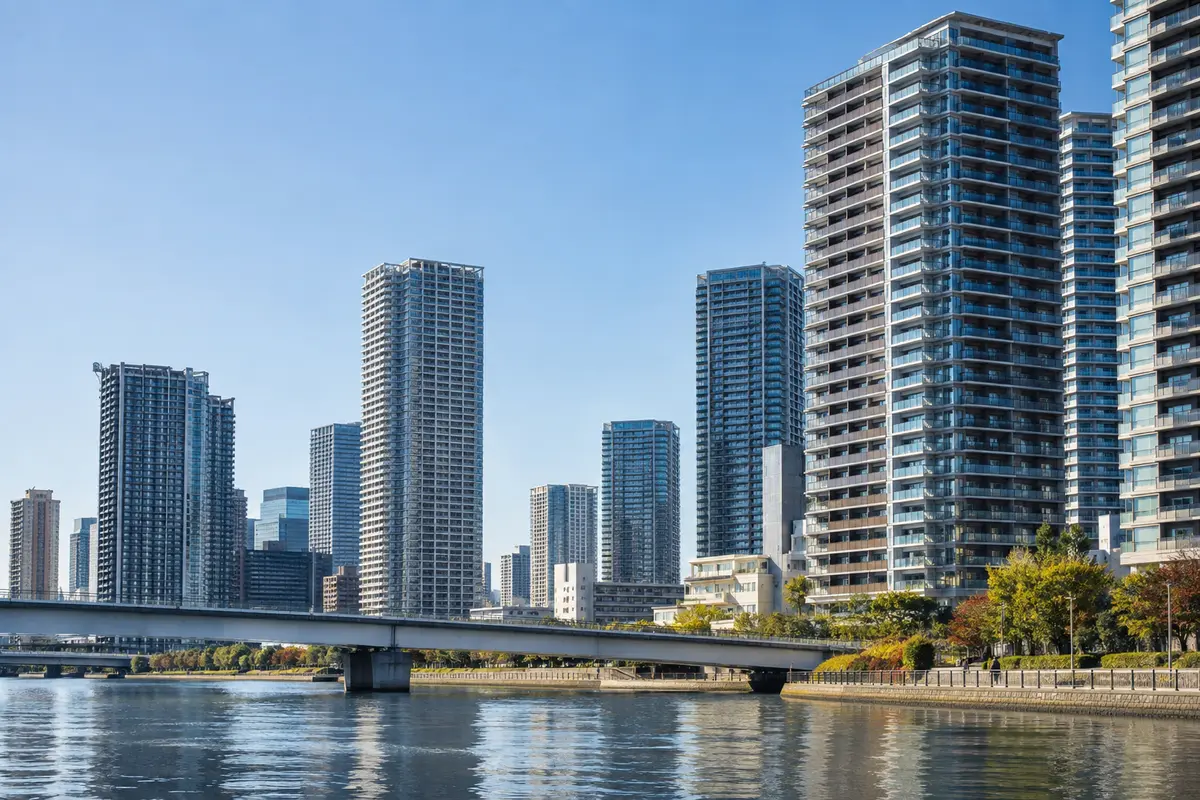
What a ¥100 million average does to ownership economics
A price threshold matters because housing finance is linear in principal. At any given interest rate and any given term, the monthly repayment on a loan scales in direct proportion to the amount borrowed: a price that is 13.1% higher means a principal that is 13.1% higher and, for a buyer with the same down payment ratio, a monthly outlay that is 13.1% higher as well. There is no dilution mechanism inside the arithmetic. When the average unit's price rises 13.1% in six months' worth of year-on-year comparison, the entire increase passes straight into the repayment stream of whoever finances it, and compounds over the life of the loan into a total interest bill larger by the same proportion.
The arithmetic of the threshold
Dividing each first-half 2026 figure by its own growth rate recovers the first-half 2025 baselines, and the recovered baselines show how much ground was covered in a single year. The metropolitan average a year earlier stood at roughly ¥89.6 million; the 23 wards at roughly ¥130.6 million; Chiba at roughly ¥57.4 million; Kanagawa at roughly ¥69.6 million; and western Tokyo outside the wards at roughly ¥68.3 million. Against those baselines the 2026 picture changes character. A year ago the ¥100 million line sat far above the metropolitan average and belonged to the central market alone: the 23-ward average cleared it while every outer ring traded below it, and Chiba's average was little more than two-fifths of the central figure. In the first half of 2026 the metropolitan average itself clears the line, Chiba's ¥89.97 million reaches about 63% of the 23-ward average, and the gap between the metropolitan average and Chiba has compressed from roughly 56% to roughly 12.6%.
From central premium to metropolitan baseline
That compression is the ownership story in one sentence: a price band that used to describe the centre now describes the average. The practical consequences follow mechanically. A ¥100 million average moves the typical new unit out of the price range in which a salaried household's mortgage capacity is the binding constraint and into the range in which cash buyers, investors and inheritance-funded purchases set the marginal price; the further the average travels into that range, the more the primary market's clearing price is set by balance sheets rather than by incomes. It also re-prices the ladder between rings. Kanagawa's ¥83.46 million now equals about 82% of the metropolitan average, against roughly 78% a year earlier, and Chiba's about 89% against roughly 64% — the discounts that once made the outer rings the affordable entry point have narrowed sharply. Western Tokyo is the exception that proves the mechanism: at ¥75.50 million it holds at about 74–76% of the metropolitan average in both years, the one ring whose relative position barely moved, and correspondingly the one ring whose growth rate, 10.5%, sits closest to the centre's.
None of this means ownership has become impossible; it means the average transaction has migrated into a different financial regime. The 23 wards, at ¥142.49 million, now sit 40.6% above the metropolitan average — a central premium that is still large in ratio terms but smaller than the premium of a year earlier, because the denominator rose faster than the numerator. The record, in short, is not only a statement about how expensive Tokyo has become. It is a statement about which part of the market now sets the definition of expensive.
Why the suburbs outrun the centre in percentage terms
Percentage growth is a ratio, and ratios flatter small bases. Chiba's 56.8% sounds like an explosion next to the 23 wards' 9.1%, and in one sense the impression is wrong: in absolute yen per unit, the comparison is closer than the percentages suggest, though still striking. On the recovered baselines, Chiba's average rose by roughly ¥32.6 million per unit while the 23 wards' rose by roughly ¥11.9 million — the suburb added nearly three times as many yen per unit as the centre did, from a base less than half the size. A small base amplifies the percentage, but it does not manufacture the yen; something real re-rated Chiba.
Scarcity pushes the frontier outward
The two drivers named in the data explain the re-rating without recourse to speculation alone. Construction costs rise everywhere and lift every new unit's price floor, but land is the variable component, and suitable land in the 23 wards is the scarcest input in the market. When the core's land supply cannot accommodate demand at any price developers can underwrite, development migrates to the next ring where plots are available, and the demand that would have cleared in the centre clears in Chiba and Kanagawa instead. Prices in the receiving rings then do double duty: they absorb the displaced demand and they capitalise the expectation that the frontier will keep moving. That is why the outer rings' growth rates lead the centre's in a supply-constrained cycle — the centre's prices are already at the level scarcity implies, while the suburbs are catching up to it.
Catch-up, or a new plateau?
The honest reading of Chiba's 56.8% is that it contains both components and the published data cannot separate them. A catch-up move corrects a mispricing: buyers who a year ago paid ¥57.4 million for a Chiba average unit were paying a discount that the metropolitan market's scarcity no longer justified, and the first half of 2026 closed part of that discount. A plateau move is different in kind: it is the market assigning Chiba a permanently higher role in the metropolitan hierarchy. The distinction is testable in the second half of the year. Catch-up decelerates once the discount is closed; a plateau holds its level and grows with costs. What the first-half data already shows is that the metropolitan average's 13.1% — faster than the centre's 9.1% — is the arithmetic signature of the outer rings' re-rating, not of central strength.

Two engines: construction costs and scarce land
Every price record has a cost side and a scarcity side, and the institute's first-half picture names both. They operate on different parts of the price and on different rings of the market, which is why their combination produces a gradient rather than a uniform rise.
- Rising construction costs act as a floor under every new unit in every ring: materials and labour enter the price of a Chiba tower and a 23-ward tower alike, which is why even the slowest ring, western Tokyo, still grew 10.5%;
- Scarce suitable land acts as a wedge that widens with proximity to the core: it is the component that makes the 23 wards' average ¥142.49 million and highest since 1973, and it is the component whose exhaustion pushes development, and then demand, into Chiba and Kanagawa.
The policy implication of that split is uncomfortable. A cost-driven component cannot be legislated away by demand-side tools; a scarcity-driven component cannot be relieved without supply that the geography of the 23 wards does not offer. What remains available to policymakers is the third variable in the market — the transaction itself — and it is exactly there that the debate has opened.
The policy debate: a sale tax to cool speculation
Against this backdrop the government is weighing a change to the condominium sale tax with the stated aim of curbing speculation. The logic of such a tool is incidence: a tax on sale raises the cost of a short holding period more than the cost of a long one, because the same levy falls on a smaller price gain when the holding period is short, and it therefore bites the flipper harder than the household that sells after a decade. Whether it works in this market depends on where the speculative pressure actually sits, and the first-half data offers a clue. If speculation were concentrated in the 23 wards, one would expect the centre's growth rate to lead; instead the centre grew 9.1% while Chiba grew 56.8%, which is consistent with speculative and investment demand rotating into the rings where the entry price is lower and the percentage upside larger.
A sale-tax change aimed at that rotation faces a familiar trade-off. Tighten it enough to deter short-horizon flipping in Chiba and Kanagawa, and the same levy raises the exit cost for ordinary owners in those rings, cooling the resale market that first-time buyers depend on. Calibrate it too gently, and the cost becomes a rounding error against a 56.8% annual re-rating. The first-half record also raises the stakes on timing: a tax introduced into a market whose average has just crossed ¥100 million arrives when buyer sensitivity is already high, because the financing arithmetic leaves no slack. The debate is therefore not only about speculation; it is about whether the state can cool the margins of the market without freezing the middle of it.
What to watch
- Chiba's second-half print: a deceleration from 56.8% would confirm a catch-up move, while a sustained level near ¥90 million would confirm a new plateau for the ring;
- The 23-ward line against its own history: ¥142.49 million is the highest since comparable data began in 1973, and any further rise extends a record with no modern precedent to compare against;
- The shape of the sale-tax change: holding-period thresholds and rate structure will decide whether it bites short-horizon flippers or ordinary resellers in the outer rings;
- The metropolitan average's distance from the ¥100 million line: a slip back below it in the second half would mark the first-half crossing as a spike rather than a new baseline;
- The two named drivers — construction costs and the supply of suitable land — because neither is responsive to the demand-side tool currently under debate.
Verdict: a threshold crossed from below
The first half of 2026 leaves the Tokyo-area condominium market with a record that is genuine, composite and awkwardly timed. Genuine, because ¥101.35 million is the printed average and ¥142.49 million in the 23 wards is the highest figure since the series began in 1973. Composite, because the metropolitan average crossed ¥100 million not on central strength alone but on a 13.1% rise that outran the centre's own 9.1%, carried by Chiba's 56.8% and Kanagawa's 20.0%. Awkwardly timed, because the policy tool under consideration — a condominium sale tax to curb speculation — would land on a market whose affordability margin has already been consumed by costs and scarcity.
For the household deciding whether to buy, the threshold is the message: the average unit now sits in a price band where balance sheets, not incomes, clear the market, and the discounts that once made the outer rings the affordable option have narrowed from roughly 56% to roughly 12.6% in the case of Chiba against the metropolitan average. For the policymaker, the divergence is the message: the pressure is rotating outward faster than any demand-side levy can be drafted. The ¥100 million line was crossed from below, by the rings the market used to call affordable. Whether it holds as a floor or fades as a spike is the question the second half of 2026 will answer.














Leave a comment